One swallow doesn't make a summer, the CFD paragliding flights will serve as a base for this reflection. Indeed, the variety of French flights and terrain, as well as the number of active pilots, make it a very good benchmark to deal with the subject of the varios’ consequences. Now that you’re familiar with the phases of XC Analytics, let’s get right to the heart of the matter. On the opposite chart, we see that the times spent gliding and floating actually increase with the varios, just as decrease the times spent climbing and propsecting. The theory is therefore verified, at least, on average for all flights, whether they are carried out in the mountains or the flatlands.

When we look at the difference between these two playgrounds, on the two charts above, we see that the crossing at 50% of time spent in each of the two categories takes place much further on the vario scale for the flatlands. Here, it is clearly the ridge soaring that explains this difference. Just as remarkable and visible on the very first chart is the relative symmetry that can be seen between the curves of climbing and floating on the one hand, and to a lesser extent, between the prospecting and gliding curves on the other. But correlation does not mean causality!
However, these distributions are stable from one year to the next, which tends to validate the idea of a certain relationship. You could then say that if you simply fly in big conditions to bring down the part of time spent in lifts, then this should necessarily contribute to improve the distance covered. Indeed, you would then spend proportionately more time in floating and climbing phases. This is also what we notice on the initial chart. But is this logical finding corroborated by the facts?


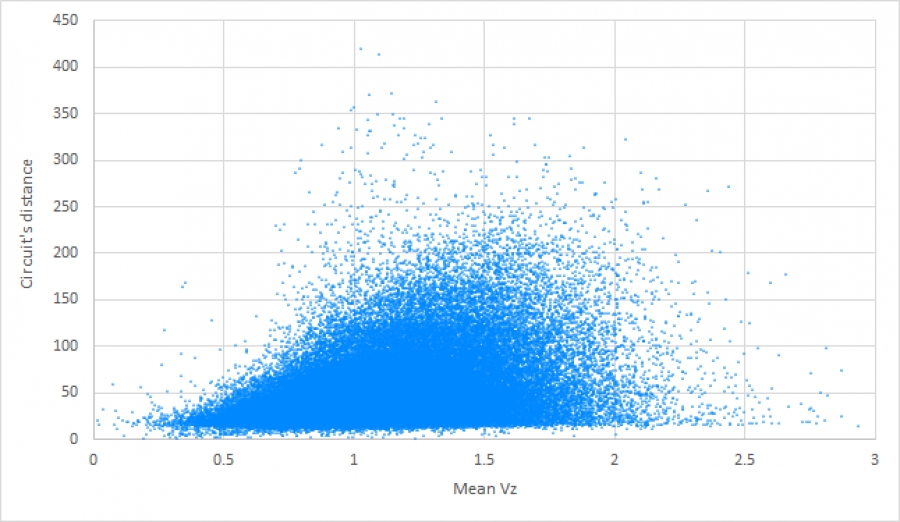
When we look at the scattered chart that puts in relation mean vario and circuit’s distance, we get the impression that this is not really the case. There is a progression of the distance up to a vario of about +1.3m/s, but beyond that, it is rather a decrease... One might then think, rightly, that this comes from the fact that days with very strong varios are rarer, and rarer are also the pilots who fly them. So if you had more pilots doing cross-country flights on those days, you would see a lot more of big flights. Maybe.
To get an idea, let’s start by sorting the scattered chart by grouping, as before, the mean varios in intervals of 0.2m/s, to match up the average circuit’s distance. Let us also add, so that it is more meaningful, the maximum circuit’s distance associated with each vario interval (we could have taken the top 10% of the best distances, but this does not change the form of the distribution), and split between flatlands and mountains. What do we find out?

We identify the general outlook of the scattered chart, but the separation by type of terrain provides additional lighting. Not only do the biggest flights not take place in conditions where the varios are the strongest, but in addition, this applies as well to the flatlands as to the mountains. And in the flatlands, the result is even more striking, because we are really far from the strongest varios for the French distance record for example, which shows only +1 to +1.2m/s of mean vario.
This is a very interesting observation, particularly from a safety point of view, where it is generally accepted that strong conditions tend to cause more accidents. It also means that we have to go further in the analysis to try to understand what produces this shift, because after all, the theory is not totally invalidated by the facts. And if that were the case, we would still have to be able to explain it, with figures to support it. Would it still be a matter of vario, and perhaps also of weather?


This is what we will see in a future article, which will again require the capabilities of XC Analytics. Besides, if you want a particular theme to be mentioned in a future article, let us know! And whether you are a competitor, club, or federation, the team is also ready to produce dedicated analyses.

")