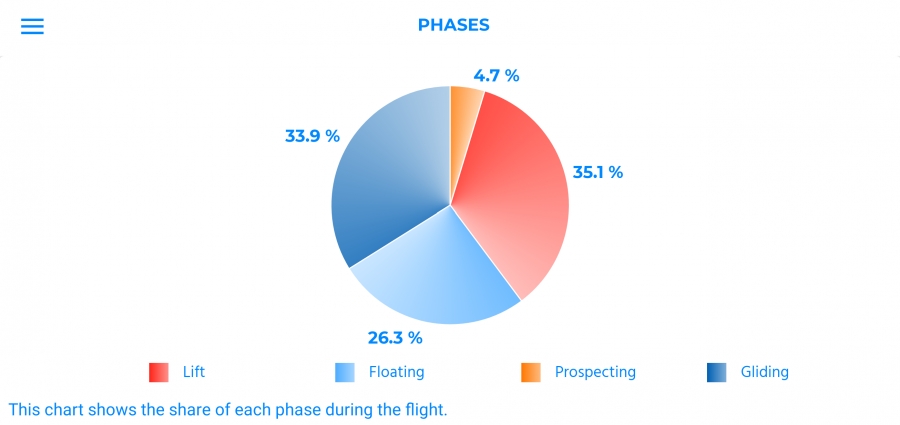
In xc analytics, we distinguish 4 types of phases: prospecting, lift, floating and gliding. A recurring question concerns the identification and definition of phases. To begin with, the "lift" goes without saying. Gliding relates to the part between two lifts, for which the sink rate exceeds the one of the glider. On the other hand, floating involves the same sequence, but for which the sink rate is better than the one of glider. Finally, the prospecting phase identifies the period during which the pilot is looking for a lift, revealed by a particular behaviour, that we managed to identify. These are simplified definitions, of course, but they offer a good glance at how phases are assigned.
So let us go further in the analysis that is allowed by these phases. This time, we focused not only on the year 2017 of the CFD, but on a comparison between the average of 3 old years, 2012, 2013 and 2014 and 3 recent years, 2017, 2018 and 2019. Why this choice? By limiting ourselves to this 5 year gap, we rely on a decent amount of data, with a range of distances that can be compared. In addition, using the average of each of the 3 years makes it easy to erase any effect related to the evolution of the material, or to a favorable (or unfavourable) weather. However, long distances (greater than 300km) are not to be trusted, as the number of flights in this category is very low, and therefore not necessarily representative. Thus we obtain the distribution table of the phases below, with distances grouped in 50k brackets.

And what do we see? First of all, that the share of each phase does not vary (or little) from one period to another. Only very large flights show a noticeable variation, but as it has been mentioned, it must not be considered significant! You could be surprised at such a result: is it due to the weather, the pilots, the circuits, or even the equipment? It’s a broad issue, and we will have an opportunity to come back to it in a future blog post. Conversely, what catches the eye is in relation to distance. As in the article of Vol Passion, we notice the same logic here, when you consider the two periods: the more the distance increases, the more the share of prospecting and and lift decrease, to give space to the floating and gliding. This regularity is striking! On this data set too, we shift from about half the time spent floating and gliding for the shorter flights, to more than two-thirds for the longer ones. The key factor of phase distribution is therefore a real marker of performance, even from a historical perspective.
The avenues for improvement for each pilot thus appear clearly: beyond the increase in flight time, the best pilots do not waste time looking for a lift and centering it. They come right on top, and position themselves perfectly with just one rotation. This involves working on our feeling, but also on our reading of the terrain, and of the sky. Reducing the share of lift requires selecting the best ones, and again, feeling and placement, both horizontally and vertically. For the latter, it may be interesting to consider the mean vario per bracket’s chart, available in the application. Finally, floating and gliding also go hand in hand, and beyond the idea of a thorough debriefing with the help of the topographic map for example, you could question the means to achieve this art of "floating", or in other words, to sink slower. In this respect, it seems that targeting the sink rate and the information you receive from your glider is better than trying to reach a certain speed.
We will also have the opportunity to come back to the avenues for improvement through xc analytics soon. In any case, for each of the themes mentioned in this post, you will find a related statistic or chart in the app. And on crowded days, comparison is an brilliant tool to identify the skills you need to develop. As we have seen, one of the first points to focus on is undoubtedly the phases’ distribution !

")